Quick Overview
Column 1
Statistical Learning and Visualization
In eight weeks we will dive into statistical learning and visualization in R. We will focus on supervised learning techniques and data wrangling in the context of data analysis and inference, as well as the connection to research philosophy. During every lecture we will treat a different theoretical aspect. Following each lecture there will be a computer lab exercise that connects the statistical theory to practice, as well as a Q&A meeting (Wednesdays @ 11am - BBG 106) wherein you can pose any and all questions that remain unanswered about the course materials, theory, practice and your practical assignments.
Assignment and Grading
The final grade is computed as follows
| Graded part | Weight |
|---|---|
| Assignment 1 | 25 % |
| Assignment 2 | 25 % |
| Exam (BYOD) | 50 % |
To develop the necessary skills for completing the assignments and
the presentations, R exercises must be made and submitted
through the course GitHub page. These exercises are not graded, but
students must fulfill them to pass the course.
In order to pass the course, the final grade must be 5.5 or higher,
your contribution to the course should be sufficient, all R
exercises should be handed in and all assignments must have a passing
grade. Otherwise, additional work is required concerning the assignments
and/or exercises you have failed.
Column 2
Schedule
| Week # | Focus | Practical | Materials | Prof |
|---|---|---|---|---|
| 1 | Data wrangling with R |
tidyverse: filter(), select(), join(), pivot(), dbplyr,
etc. |
R4DS | GV |
| 2 | The grammar of graphics | ggplot(): geoms, aesthetics,
scales, themes |
R4DS | GV |
| 3 | Exploratory data analysis | Histograms, density plots,
boxplots, etc. |
R4DS FIMD Ch1 | GV |
| 4 | Statistical learning: regression | lm(), glm(), knn() |
ISLR | MC |
| 5 | Statistical learning: classification | glm(), trees, lda() |
ISLR | EJvK |
| 6 | Classification model evaluation | prop.table(), pROC(), etc. |
ISLR | EJvK |
| 7 | Nonlinear models | R formulas advanced |
ISLR | MC |
| 8 | Bagging, boosting, random forest and support vector machines | randomforest, xgboost |
ISLR | MC |
Course Manual
Column 1
Course description
Supervised learning is such an integral part of contemporary data science, that you will most likely use it dozens of times a day, without knowing it. In this class you will learn about the most effective supervised learning techniques and you will acquire the skills to implement them to work for you.We will not only discuss the theoretical underpinnings of supervised learning, but focus also on the skills and experience to rapidly apply these techniques to new problems.
During this course, participants will actively learn how to apply the main statistical methods in data analysis and how to use machine learning algorithms and visualizing techniques. The course has a strongly practical, hands-on focus: rather than focusing on the mathematics and background of the discussed techniques, you will gain hands-on experience in using them on real data during the course and interpreting the results. This course provides a broad introduction to supervised learning and visualization. Topics include:
- Data manipulation and data wrangling with
R - Data visualization
- Exploratory data analysis
- Regression and classification
- Non-linear modeling
- Bagging, boosting and ensemble learning
Students will learn to adapt these techniques in their way of
thinking about analyses problems. We will consider statistical learning
techniques in the context of estimation, testing and prediction.
Students will learn to adapt these techniques in their way of thinking
about statistical inference, which will help students to quantify the
uncertainty and measure the accuracy of statistical estimates. Students
will develop fundamental R programming skills and will gain
experience with tidyverse, visualize data with
ggplot2 and perform basic data wrangling techniques with
dplyr. This course makes students better equipped for a
further career (e.g. junior researcher or research assistant) or
education in research, such as a (research) Master program, or a
PhD.
Assignment
Students will form groups to choose work on two assigments. Students
will need to perform calculations and program code for these assigments.
All work needs to be combined in an easy understandable, self-contained
and insightful RStudio project and must be submitted to the
Course submission
GitHub page. Each assigment will be graded.
Grading
Students will be evaluated on the following aspects:
- apply and interpret the theories, principles, methods and techniques related to contemporary data science, and understand and explain different approaches to data analysis:
- apply data wrangling and preprocessing techniques to tidy data sets
- apply, implement, understand and explain methods and techniques that
are associated with statistical learning, including regression, trees,
clustering, classification techniques and learning ensembles in
R - evaluate the performance of these techniques with appropriate performance measures.
- select appropriate techniques to solve specific data science problems
- motivate and explain the choice for techniques to investigate data problems
- implement and understand generic data science tools, such as
bootstrapping, cross validation, bagging, boosting and error evaluation
in
R - interpret and evaluate the results of analyses and explain these techniques in simple terminology to a broad audience
- understand and explain the basic principles of data visualization and the grammar of graphics.
- construct appropriate visualizations for each data analysis technique in R
Relation between assessment and objective
In this course, skills and knowledge are evaluated on these separate occasions:
- With the exam and the assignments the knowledge from methodological and statistical concepts is evaluated, as well as the application of these concepts to research scenarios. During the exam students need to interpret, evaluate and explain statistical software output and results.
- With the practical lab and the assignments it is tested if the student has sufficient skills to solve analysis problems and execute the relevant methodology on real-life data sets.
After taking this course students can understand innovations in statistical markup, statistical simulation and reproducible research. Students are also able to approach challenges from different professional viewpoints. They have gained experience in marking up a professional manuscript and designing a state-of-the-art statistical archive in an open source repository.
How to prepare
Column 1
Preparing your machine for the course
Dear all,
This semester you will participate in the Supervised Learning
& Visualization course at Utrecht University. To realize a
steeper learning curve, we will use some functionality that is not part
of the base installation for R. Many of you are already
familiar with R. The below guide serves as a point of
departure for those who are not. The following steps guide you through
installing both R as well as some of the necessary
packages.
I look forward to see you all,
Gerko Vink
System requirements
Bring a laptop computer to the course and make sure that you have full write access and administrator rights to the machine. We will explore programming and compiling in this course. This means that you need full access to your machine. Some corporate laptops come with limited access for their users, I therefore advice you to bring a personal laptop computer to the workgroup meetings.
1. Install R
R can be obtained here. We won’t use R
directly in the course, but rather call R through
RStudio. Therefore it needs to be installed.
2. Install RStudio Desktop
Rstudio is an Integrated Development Environment (IDE). It can be
obtained as stand-alone software here.
The free and open source RStudio Desktop version is
sufficient.
3. Start RStudio and install the following packages.
Execute the following lines of code in the console window:
install.packages(c("ggplot2", "tidyverse", "magrittr", "micemd", "jomo", "pan",
                 "lme4", "knitr", "rmarkdown", "plotly", "ggplot2", "shiny",
                 "devtools", "boot", "class", "car", "MASS", "ggplot2movies",
                 "ISLR", "DAAG", "mice"),
                 dependencies = TRUE)
If you are not sure where to execute code, use the following figure to identify the console:
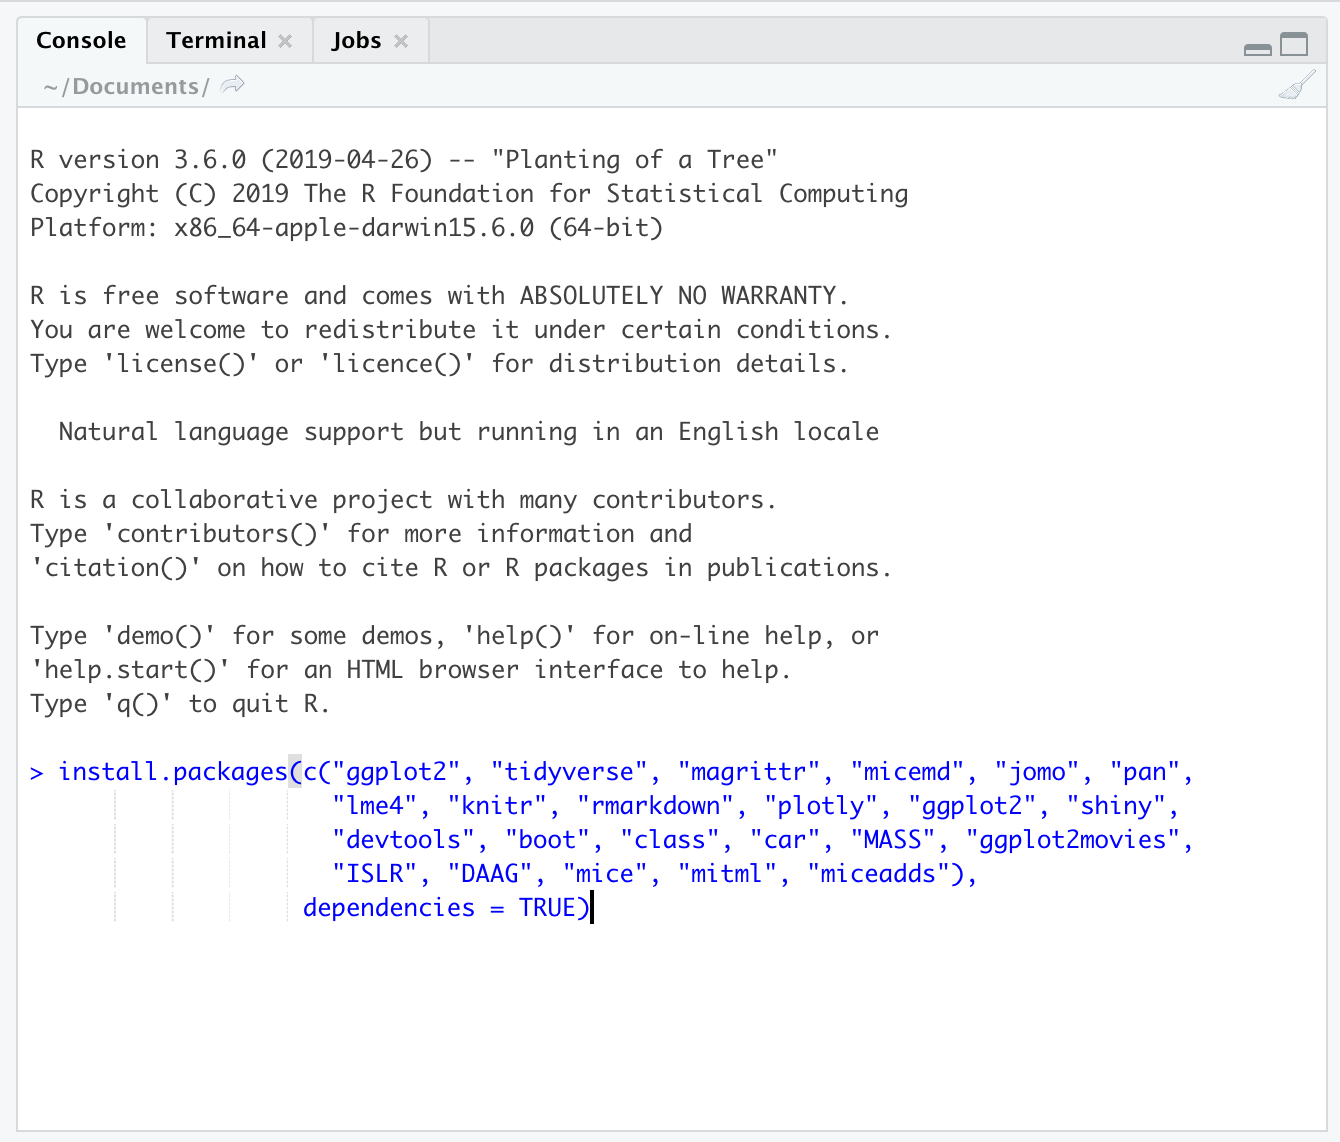
Just copy and paste the installation command and press the return key. When asked
Do you want to install from sources the package which needs
compilation? (Yes/no/cancel)
type Yes in the console and press the return key.
Column 2
What if the steps to the left do not work for me?
If all fails and you have insufficient rights to your machine, the following web-based service will offer a solution.
- Open a free account on rstudio.cloud. You can run your own
cloud-based
RStudioenvironment there. - Use Utrecht University’s MyWorkPlace. You would have access
to
RandRStudiothere. You may need to install packages for new sessions during the course.
Naturally, you will need internet access for these services to be accessed.
Assignments
Column 1
Week 1
Column 1
Lecture (Monday 9am - BBG 201)
Please find the Lecture Slides here
Practical
This week’s practical is on data wrangling. The answers are also given to you. Use these answers to help yourself when you’re stuck.
- Practical 1: Data wrangling
- Practical 1: Data wrangling with answers
- googleplaystore.csv
- students.xlsx
- SLV_practical1 - or create your own project
Hand in by PR from your fork here. Ask questions through GitHub issues here
If you are unfamiliar with GitHub, forking and/or pull-request, please study this exercise from one of my other courses. There you can find video walkthroughs that detail the process.
A must watch
The below 4-part series by Garrett Grolemund ondplyr and
the tidyverse is very informative: Column 2
Useful links
The following links may be useful
Week 2
Column 1
Practical
This week’s practical is on data visualization. Code solutions are also given to you. Use these answers to help yourself when you’re stuck.
- Practical 2: Data visualization
- Practical 2: Data visualization with code solutions
- SLV_practical2 - or create your own project
Hand in by PR from your fork here. Ask questions through GitHub issues here
Must watch
The following lecture by Dewey
Dunnington is quite informative. Also for those that already (think
they) know the ggplot2 package.
Column 2
Useful links
The following links may be useful
- A Harvard Business Review article on communication through visuals. Good to also study some content that relate to the business-side of information exchange.
ggplot’s reference page- A simulation that demonstrates the (mis)use of confidence intervals
Week 3
Column 1
Lecture (Monday 9am - BBG 201)
This week’s slides:
- Lecture Slides part 1
- Lecture Slides part 2
- The titanic set from part 2. I
don’t remember where I got it from, originally. There is also a copy of
the
titanicdata inR, but I found this data set and its labeling to be more informative.
Q&A
During the Q&A session on Wednesday, we will devote some time to missing data analysis
If you’d like to get rid of theDS_Store files that Mac
systems generate, then run the following in the terminal:
cd "PATH TO YOUR GIT REPO"
git rm --cached "*.DS_Store"
git commit -m "remove all .DS_Store"
Practical
This week’s practical is on exploratory data analysis. Code solutions are also given to you. Use these answers to help yourself when you’re stuck.
Hand in by PR from your fork here. Ask questions through GitHub issues here
Column 2
Required reading
Study the following materials
Useful links
The following links may be useful
- A wonderful post about misusing the y-axis.
ggplot’s reference page- A tool to pick color palettes including palettes that are color-blind accessible.
- A color palette tutorial for seaborn, vega-altair, and ggplot2
Week 4
Column 1
Practical
This week’s practical is on regression. Code solutions are also given to you. Use these answers to help yourself when you’re stuck.
Hand in by PR from your fork here. Ask questions through GitHub issues here
Column 2
Week 5
Column 1
Practical
This week’s practical is on classification. Code solutions are also given to you. Use these answers to help yourself when you’re stuck.
Hand in by PR from your fork here. Ask questions through GitHub issues here
NOT HAND IN, BUT STILL USEFUL: I also give you the
following practical from last year. Please view and study the practical
up to and including Exercise 10. No need to hand anything in. All the
regularization (glmnet) exercises 11-19 are not relevant
for this course, but you may of course use the methods in your
Assignment 2 if you wish. Let me know if you have any questions.
Column 2
Week 6
Column 1
Practical
This week’s practical is on classification. Code solutions are also given to you. Use these answers to help yourself when you’re stuck.
Hand in by PR from your fork here. Ask questions through GitHub issues here
Column 2
Week 7
Column 1
Practical
This week’s practical is on nonlinear regression. Code solutions are also given to you. Use these answers to help yourself when you’re stuck.
Hand in by PR from your fork here. Ask questions through GitHub issues here
Column 2
Week 8
Column 1
Practical
This week’s practical is on nonlinear regression. Code solutions are also given to you. Use these answers to help yourself when you’re stuck.
Hand in by PR from your fork here. Ask questions through GitHub issues here
Column 2
Practice Exam
Column 1
Practice Exam
This exam gives an idea of the type of questions that could have been expected last year. It is by no means meant to be representative in length nor difficulty with respect to the actual exam. The actual exam is usually a bit longer.