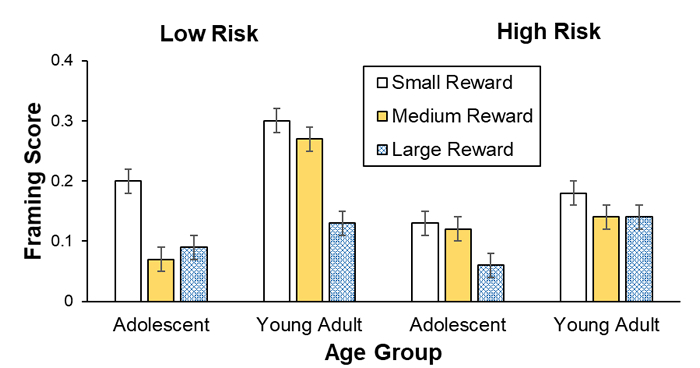
- discussion and emphasis
Markup Languages and Reproducible Programming in Statistics
Today
Figures

Figures
<center>  </center>
Another figure
<center>  </center>

Another figure
<center>
{width=40%}
</center>
Another figure
<center>
<img src = "https://cdn-ssl.s7.disneystore.com/is/image/DisneyShopping/6101036512835"
width = 40% />
</center>
Another figure
{r, out.width = "30%", fig.align = 'center'}
library(knitr)
fig <- "https://cdn-ssl.s7.disneystore.com/is/image/DisneyShopping/6101036512835"
include_graphics(fig)
R figures
{r, fig.width=3, fig.height=1}
library(dygraphs)
dygraph(nhtemp, main = "New Haven Temperatures", ylab = "Temp (F)")
R figures
{r, fig.width=6, fig.height=2.5}
library(dygraphs)
dygraph(nhtemp, main = "New Haven Temperatures", ylab = "Temp (F)")
R figures
library(ggplot2, warn.conflicts = FALSE)
library(plotly, warn.conflicts = FALSE)
p <- ggplot(mpg, aes(displ, hwy, colour = class)) +
  geom_point() +
  geom_smooth(se = FALSE, method = lm)
p %>% ggplotly()
R figures
Equations
$\mu$is used for in-line equations$$\mu$$is used for equations
Let’s assume that \(Y\) follows a normal distribution. \[Y \sim \mathcal{N}(\mu, \sigma^2)\] Where we set in our simulations \(\mu = 10\) and \(\sigma^2 = 5\). We do something for every \(Y_i\).
Equations
$\mu$is used for in-line equations$$\mu$$is used for equations
Let’s assume that \(y\) is a vector with \(N\) elements such that \[y \sim \mathcal{N}(\mu, \sigma^2),\] where we set in our simulations \(\mu = 10\) and \(\sigma^2 = 5\). We do something for every \(Y_i\) with \(i = 1, \dots, N\).
Columns
<div style="float: left; width: 60%;">
{width=90%}
</div>
<div style="float: right; width: 40%;">
YOUR TEXT
</div>
<div style="clear: both;"></div>
REMAINDER OF THE SLIDE WITHOUT COLUMNS
Columns
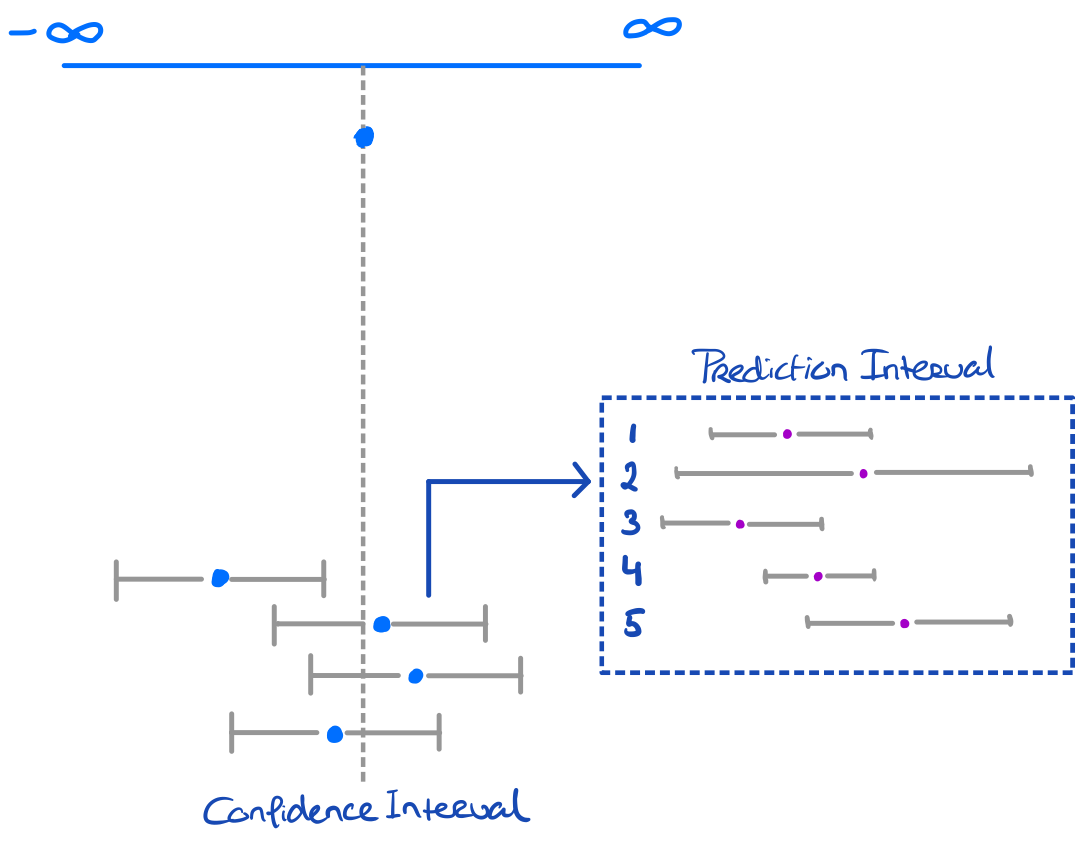
Prediction intervals can also be hugely informative!
Prediction intervals are generally wider than confidence intervals
- This is because it covers inherent uncertainty in the data point on top of sampling uncertainty
- Just like CIs, PIs will become more narrow (for locations) where more information is observed (less uncertainty)
- Usually this is at the location of the mean of the predicted values.
Tables
library(xtable); library(mice); library(dplyr)
dat <- nhanes %>% head
xtable(dat)
## % latex table generated in R 4.2.2 by xtable 1.8-4 package
## % Wed Nov 23 06:59:04 2022
## \begin{table}[ht]
## \centering
## \begin{tabular}{rrrrr}
##   \hline
##  & age & bmi & hyp & chl \\
##   \hline
## 1 & 1.00 &  &  &  \\
##   2 & 2.00 & 22.70 & 1.00 & 187.00 \\
##   3 & 1.00 &  & 1.00 & 187.00 \\
##   4 & 3.00 &  &  &  \\
##   5 & 1.00 & 20.40 & 1.00 & 113.00 \\
##   6 & 3.00 &  &  & 184.00 \\
##    \hline
## \end{tabular}
## \end{table}
Tables
library(kableExtra)
##
## Attaching package: 'kableExtra'
## The following object is masked from 'package:dplyr':
##
##     group_rows
dat %>%
  kbl
| age | bmi | hyp | chl |
|---|---|---|---|
| 1 | NA | NA | NA |
| 2 | 22.7 | 1 | 187 |
| 1 | NA | 1 | 187 |
| 3 | NA | NA | NA |
| 1 | 20.4 | 1 | 113 |
| 3 | NA | NA | 184 |
Tables
dat %>%
  kbl %>%
  kable_paper("hover", full_width = FALSE)
| age | bmi | hyp | chl |
|---|---|---|---|
| 1 | NA | NA | NA |
| 2 | 22.7 | 1 | 187 |
| 1 | NA | 1 | 187 |
| 3 | NA | NA | NA |
| 1 | 20.4 | 1 | 113 |
| 3 | NA | NA | 184 |
Tables
dat %>%
  kbl(caption = "nhanes") %>%
  kable_classic(full_width = FALSE, html_font = "Arial")
| age | bmi | hyp | chl |
|---|---|---|---|
| 1 | NA | NA | NA |
| 2 | 22.7 | 1 | 187 |
| 1 | NA | 1 | 187 |
| 3 | NA | NA | NA |
| 1 | 20.4 | 1 | 113 |
| 3 | NA | NA | 184 |
Tables
dat %>%
  kbl(caption = "nhanes") %>%
  kable_classic_2(full_width = FALSE, html_font = "Arial")
| age | bmi | hyp | chl |
|---|---|---|---|
| 1 | NA | NA | NA |
| 2 | 22.7 | 1 | 187 |
| 1 | NA | 1 | 187 |
| 3 | NA | NA | NA |
| 1 | 20.4 | 1 | 113 |
| 3 | NA | NA | 184 |
Tables
library(DT)
nhanes %>%
  datatable(options = list(pageLength = 7))